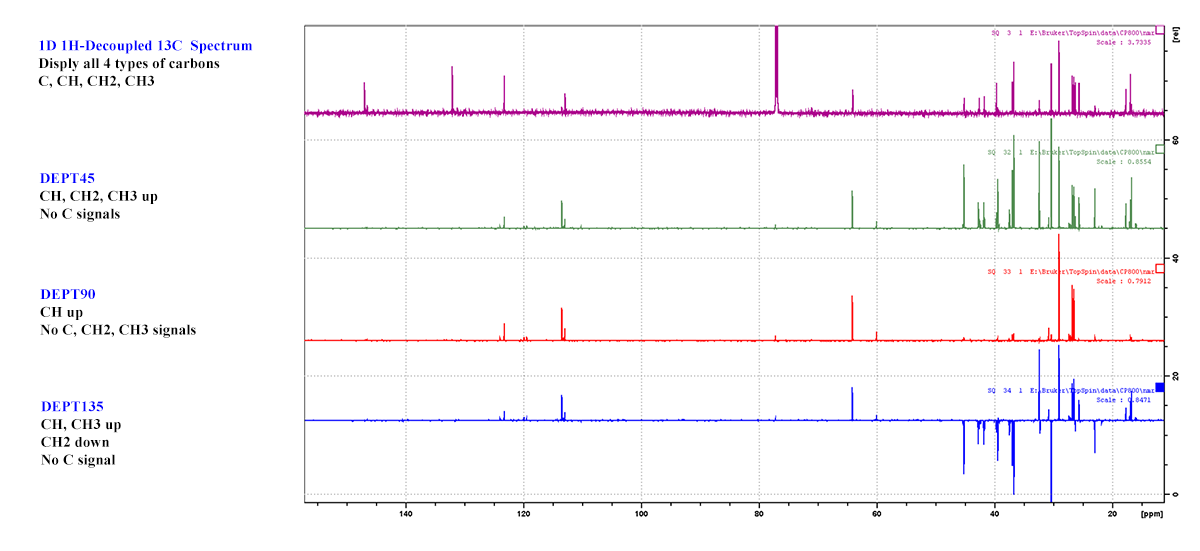
13C DEPT: To differentiate different types of carbons in a chemical compound
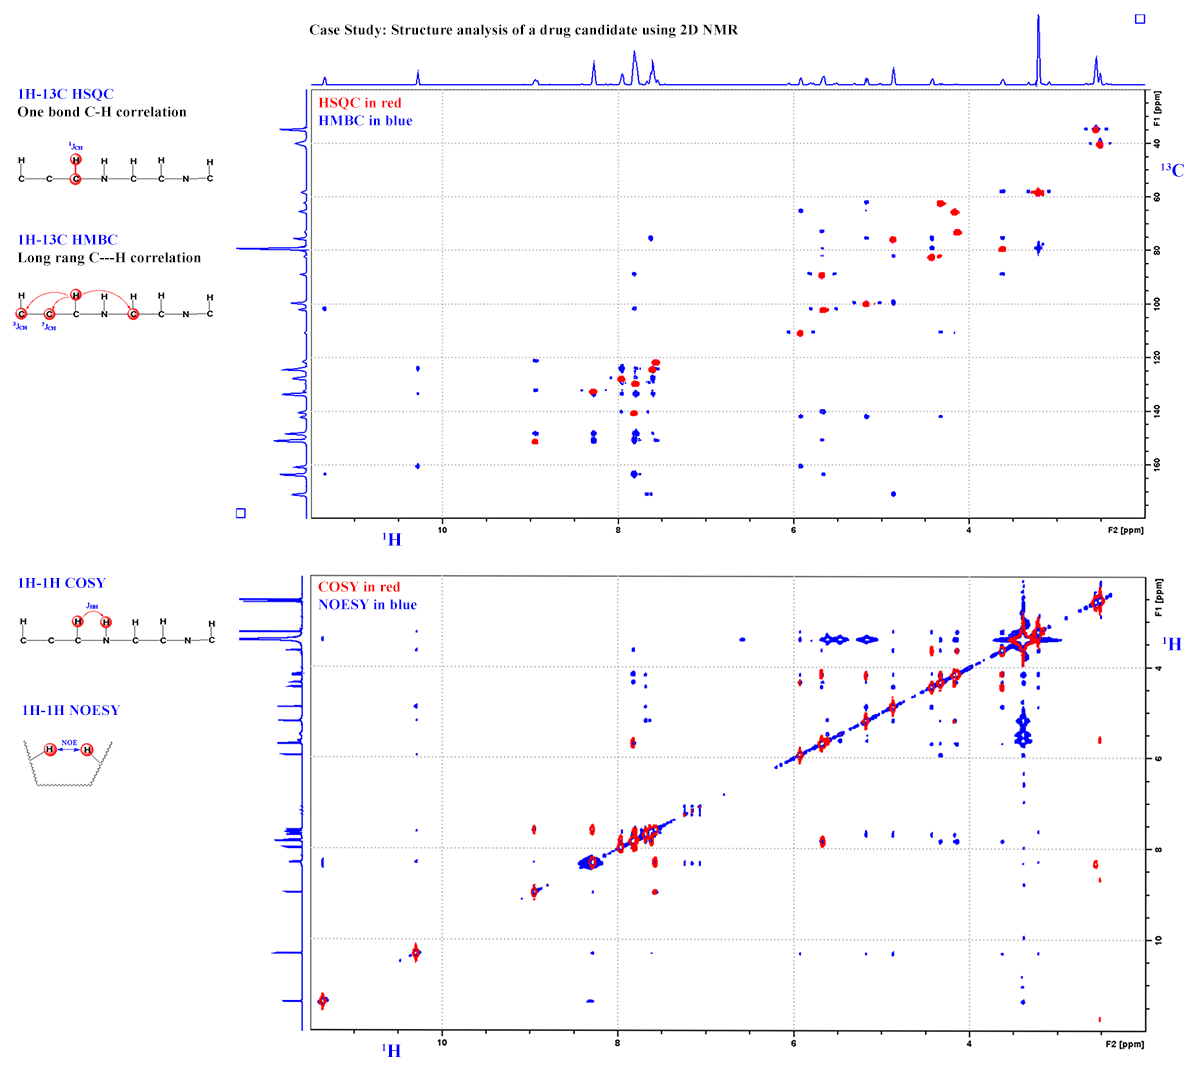
2D Experiments for Chemical Structural Characterization: Looking for connectivity
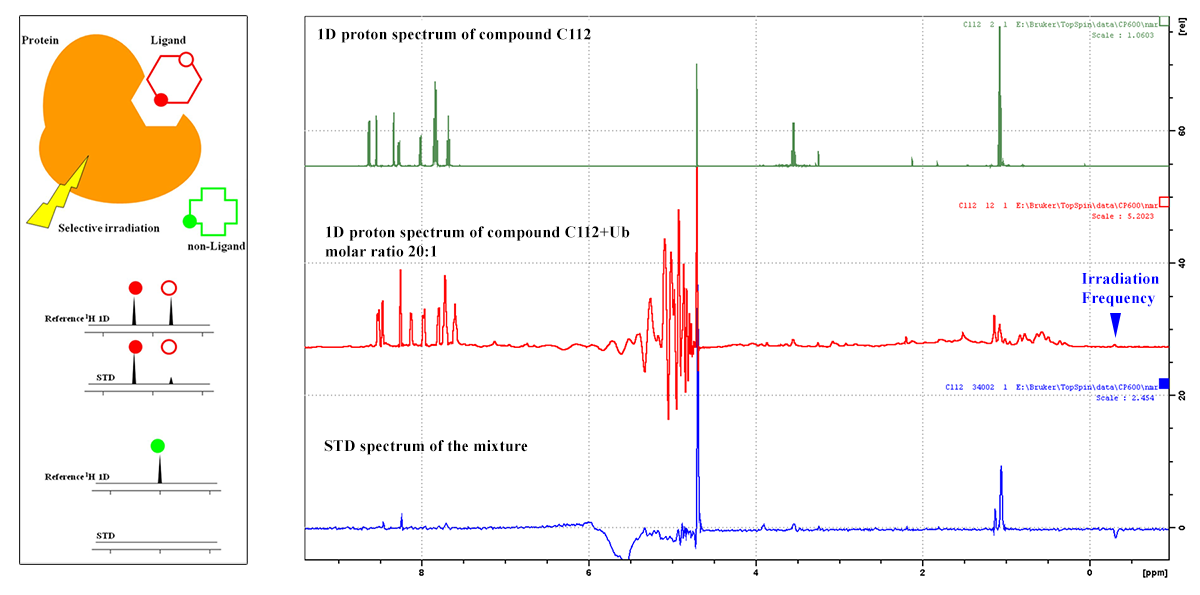
Saturation Transfer Difference (STD): To identify biomolecule/ligand interactions
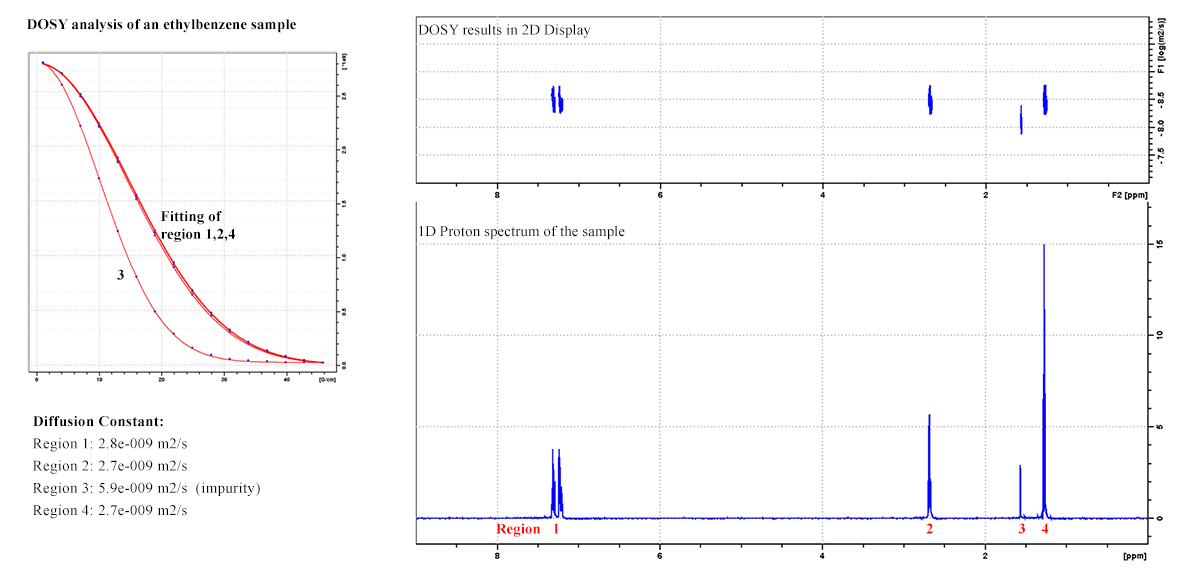
Diffusion Ordered Spectroscopy (DOSY): To resolve different compounds in a mixture based on differing translational diffusion coefficients
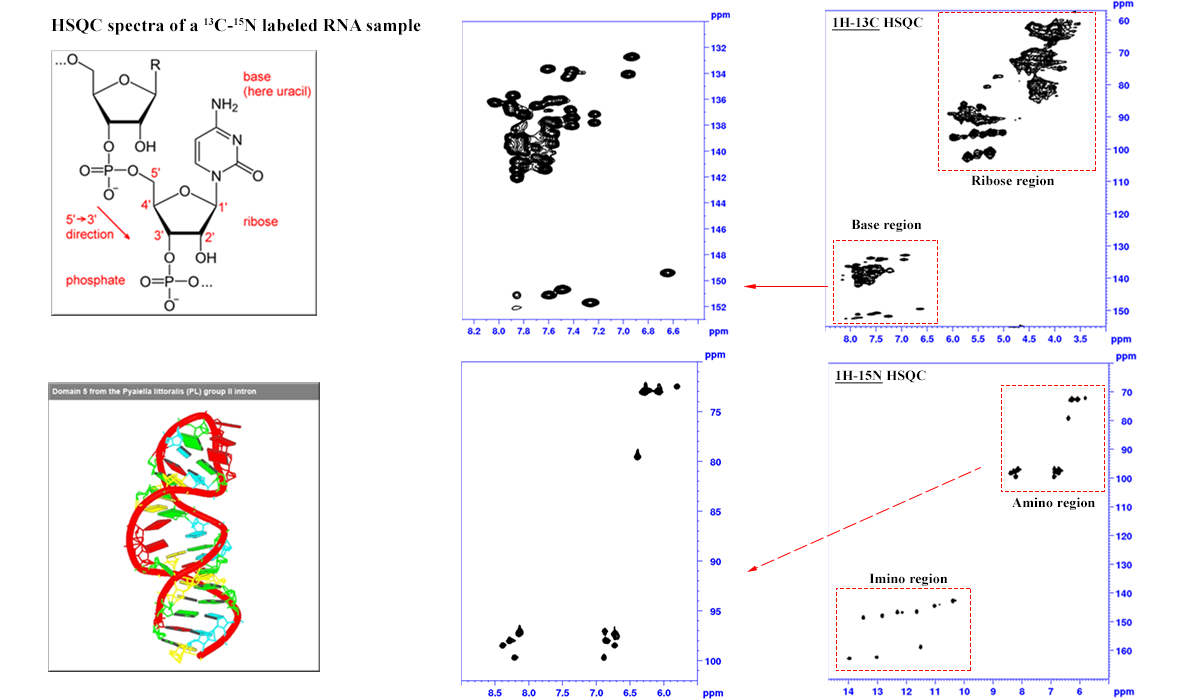
RNA HSQC experiments: Identifying secondary structure elements
Run triple resonance experiments to establish residue connectivity in a protein sequence

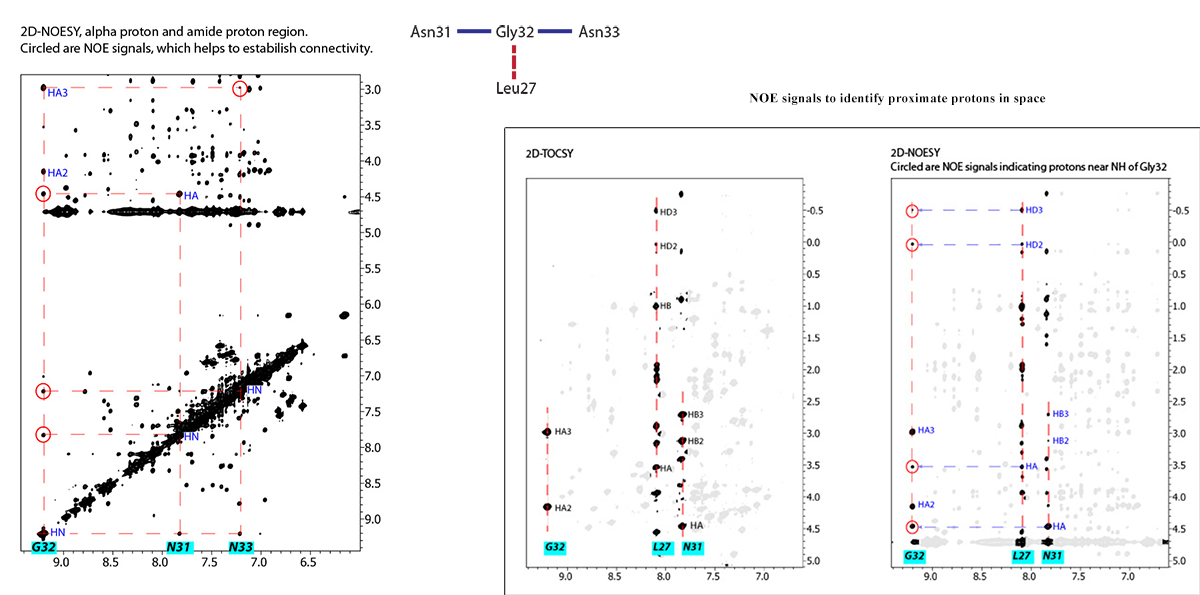
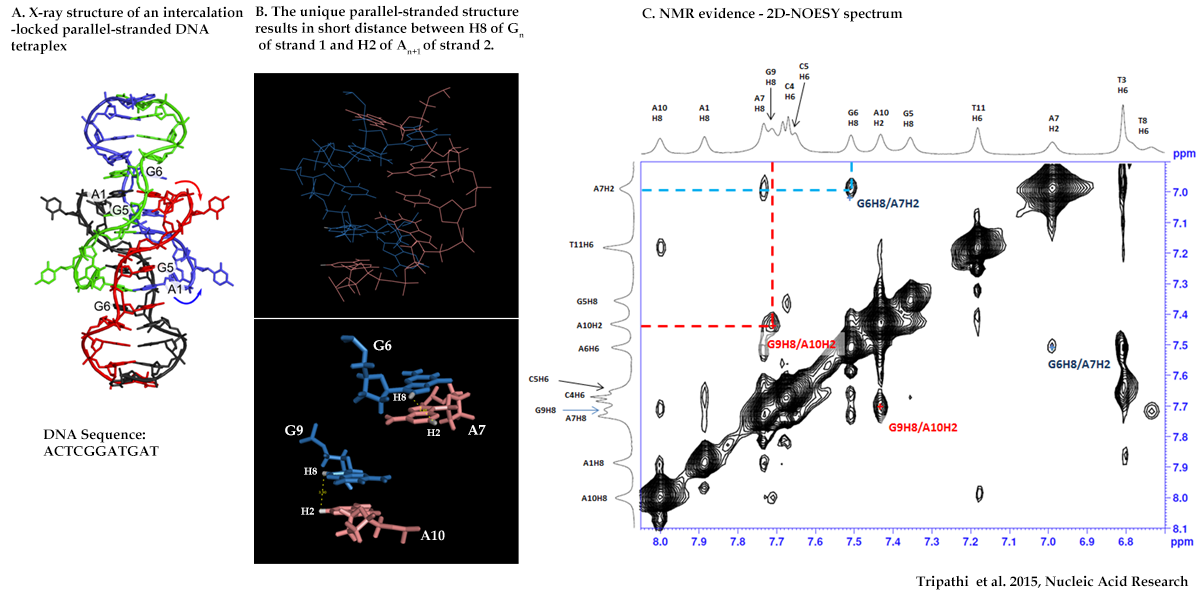
NOESY Experiment: To identify proximate protons in space and in adjacent residues
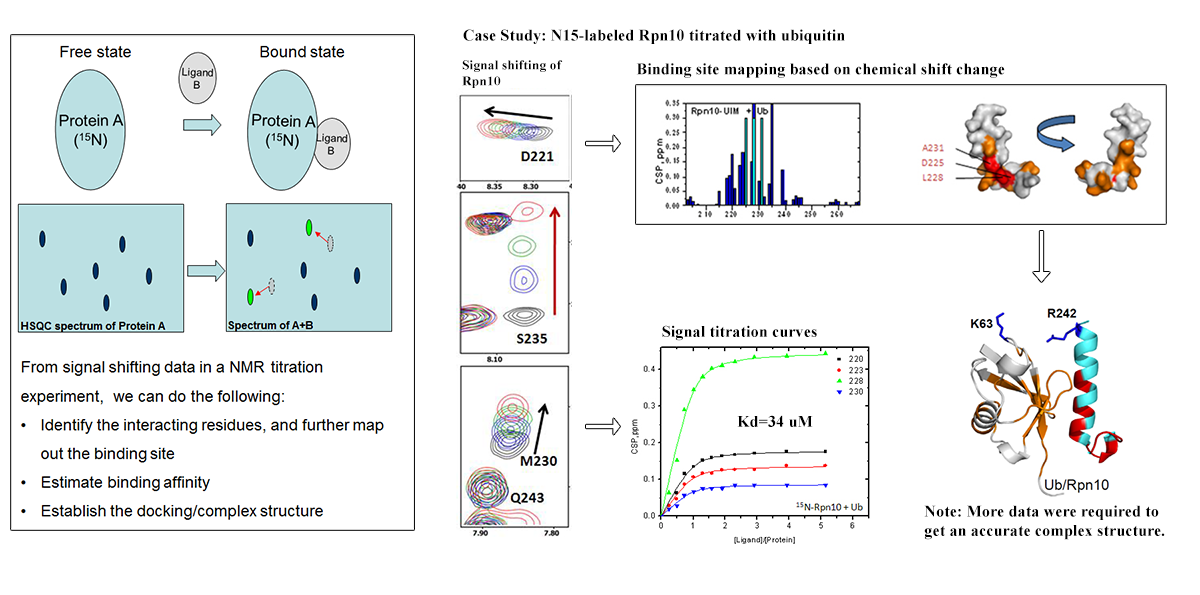
NMR Titration: To quantify a protein/ligand interaction, and more...
NMR Evidence of DNA parallel-strand formation in solution
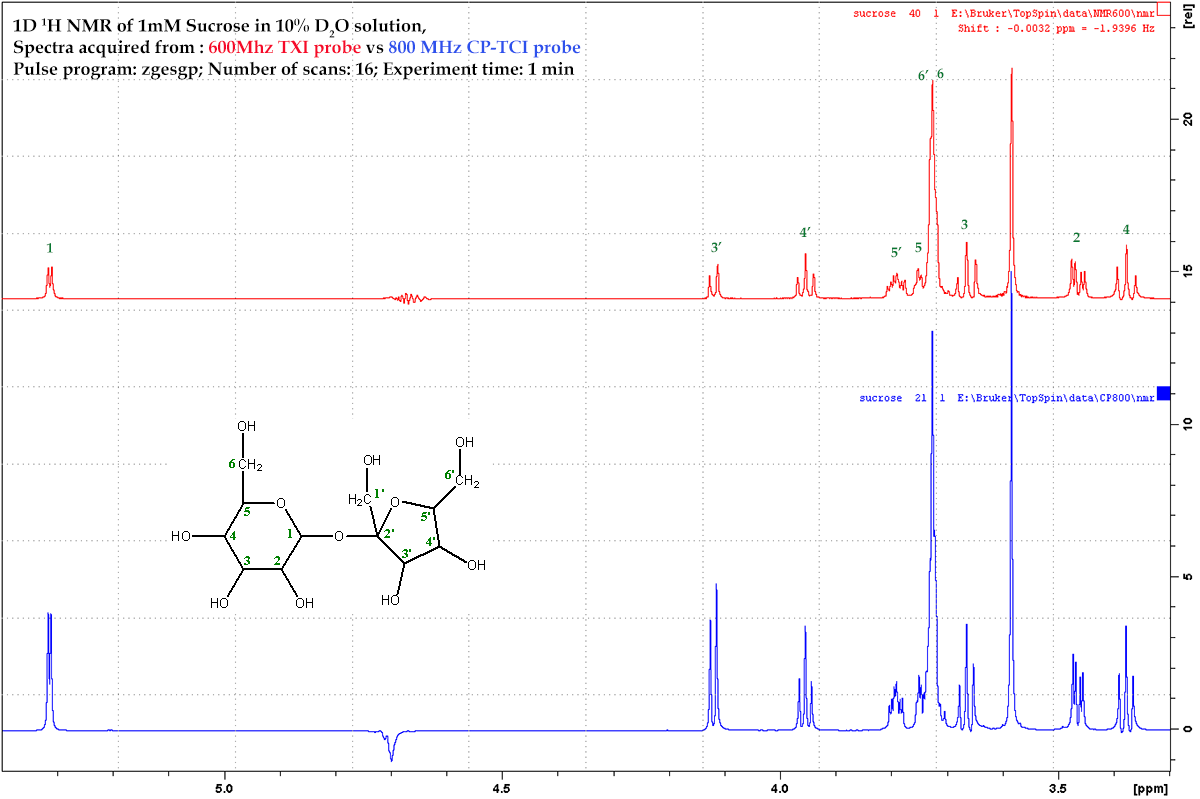
Comparison of probe sensitity